If you are fascinated by the stars in the night sky, you might wonder how astronomers can learn so much about them. How do they know their sizes, masses, ages, and compositions? One of the key properties that helps us understand stars is their temperature. But how can we measure the temperature of something that is so far away and so hot? And which property of a star is closely related to its temperature? In this article, we will explore these questions and learn more about the amazing diversity of stars.
Temperature and Color
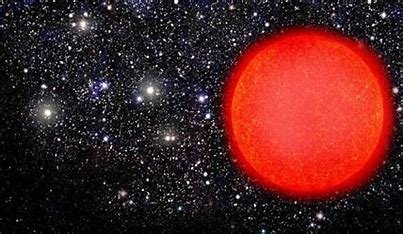
One of the easiest ways to estimate the temperature of a star is to look at its color. Just like a piece of metal that glows red when heated and white when heated even more, stars emit different colors of light depending on their surface temperature. The hottest stars are blue, while the coolest stars are red. In between, there are stars that are white, yellow, or orange.
The color of a star is determined by its spectrum, which is the distribution of light across different wavelengths or frequencies. The spectrum of a star depends on two factors: the blackbody radiation and the absorption lines. Blackbody radiation is the light emitted by any object that has a temperature above absolute zero. The higher the temperature, the more energy and shorter wavelengths the blackbody radiation has. Absorption lines are dark gaps in the spectrum caused by certain elements in the star’s atmosphere that absorb some wavelengths of light.
By measuring the spectrum of a star, astronomers can compare it to a standard set of spectral types that range from O (blue) to M (red), with intermediate types B, A, F, G, and K. Each spectral type corresponds to a range of temperatures, as shown in the table below.
| Spectral Type | Color | Temperature (K) |
| O | Blue | 30,000 – 60,000 |
| B | Blue | 10,000 – 30,000 |
| A | White | 7,500 – 10,000 |
| F | White | 6,000 – 7,500 |
| G | Yellow | 5,000 – 6,000 |
| K | Orange | 3,500 – 5,000 |
| M | Red | 2,500 – 3,500 |
Our Sun is a G-type star with a surface temperature of about 5,800 K. It appears yellow to our eyes because it emits more green and yellow light than other colors. However, if we look at it through a prism or a rainbow, we can see that it actually emits all colors of visible light.
Temperature and Luminosity
Another property of a star that is closely related to its temperature is its luminosity. Luminosity is the total amount of energy (light) that a star emits into space per unit time. It depends on both the surface area and the surface temperature of the star. The larger and hotter the star, the more luminous it is.
To measure the luminosity of a star, we need to know two things: its apparent brightness and its distance. Apparent brightness is how bright a star appears to us from Earth. It depends on both the luminosity and the distance of the star. The farther away a star is, the dimmer it appears. Distance is often measured in parsecs (pc), where one parsec is equal to 3.26 light-years or 3.09 x 10^13 km.
The relationship between apparent brightness (b), luminosity (L), and distance (d) is given by the inverse square law:
�=�4��2b=4πd2L
By rearranging this equation, we can find the luminosity of a star if we know its apparent brightness and distance:
�=4��2�L=4πd2b
However, measuring the distance of stars is not easy. One method that astronomers use is called parallax, which is the apparent shift in position of an object when viewed from different angles. By observing how much a nearby star shifts against the background of distant stars over six months (when Earth orbits half way around the Sun), astronomers can calculate its parallax angle (p) in arcseconds. The smaller the parallax angle, the farther away the star is. The relationship between parallax angle and distance is given by:
�=1�d=p1
where d is in parsecs and p is in arcseconds.
Using this method, astronomers can measure the distances and luminosities of stars within about 100 parsecs from Earth. For more distant stars, other methods are needed, such as using standard candles (objects with known luminosities) or comparing the spectra and brightnesses of stars with similar properties.
Once we have the luminosities and temperatures of many stars, we can plot them on a graph called the Hertzsprung-Russell (H-R) diagram. The H-R diagram is a powerful tool that reveals the patterns and relationships among stars. It shows that most stars lie along a diagonal band called the main sequence, where the hotter and more luminous stars are at the upper left and the cooler and less luminous stars are at the lower right. Our Sun is a typical main sequence star. The main sequence represents the stage of a star’s life when it is stably burning hydrogen into helium in its core. The mass of a star determines its position on the main sequence, with more massive stars being hotter and more luminous than less massive stars.
The H-R diagram also shows that some stars deviate from the main sequence. These are stars that have exhausted their hydrogen fuel in their core and have moved on to different stages of their evolution. For example, red giants are stars that have expanded and cooled after burning hydrogen in a shell around their inert helium core. White dwarfs are the remnants of low-mass stars that have shed their outer layers and exposed their hot, dense cores. Supergiants are very massive stars that have become extremely bright and unstable after fusing heavier elements in their cores.
The H-R diagram of a representative group of stars. Credit: OpenStax
Conclusion
In this article, we have learned that the temperature of a star is closely related to its color and luminosity. By measuring these properties, we can classify stars into different spectral types and plot them on the H-R diagram. The H-R diagram reveals the patterns and relationships among stars, as well as their evolutionary stages. Stars are amazing objects that can teach us a lot about the universe and ourselves.