If you are running a manufacturing business, you need to keep track of how much it costs you to produce your products. This is not only important for managing your operations, but also for reporting your financial performance to your stakeholders. One of the tools that can help you do this is the cost of goods manufactured schedule.
The cost of goods manufactured schedule is a statement that shows the total production costs for a specific period of time. It calculates how much it costs you to transform raw materials into finished goods that are ready for sale. It also adjusts for the changes in your work-in-process inventory, which is the inventory of partially completed products.
The cost of goods manufactured schedule is related to the income statement, which is one of the three major financial statements that report your company’s profitability over a specific accounting period. The income statement shows your revenue, expenses, gains, and losses from both operating and non-operating activities.
The cost of goods manufactured amount is transferred to the finished goods inventory account, which is part of the balance sheet. The balance sheet shows your company’s assets, liabilities, and equity as of a specific date. The finished goods inventory account represents the value of the products that are ready for sale but have not been sold yet.
The cost of goods sold amount is then calculated by subtracting the ending finished goods inventory balance from the beginning finished goods inventory balance plus the cost of goods manufactured. The cost of goods sold amount is reported on the income statement as an expense that is deducted from your sales revenue to determine your gross profit.
The gross profit is a measure of how much you earn from selling your products before considering other expenses such as marketing, administration, interest, and taxes. The gross profit margin is the ratio of gross profit to sales revenue, expressed as a percentage. It indicates how efficiently you manage your production costs and how much markup you charge on your products.
The cost of goods manufactured schedule helps you understand your income statement by showing you how your production costs affect your gross profit and gross profit margin. By analyzing this schedule, you can identify areas where you can reduce your production costs, improve your product quality, increase your sales volume, or adjust your pricing strategy. This can help you improve your profitability and competitiveness in the market.
Example of Cost of Goods Manufactured Schedule and Income Statement
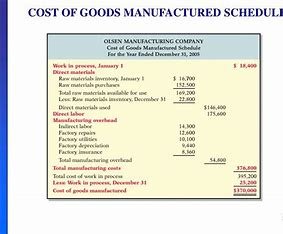
To illustrate how the cost of goods manufactured schedule is related to the income statement, let’s look at an example of a hypothetical company that manufactures furniture. The following table shows the company’s cost of goods manufactured schedule for the year ended December 31, 2023:
| Cost of Goods Manufactured Schedule | |
| Beginning raw materials inventory | $10,000 |
| Add: Purchases of raw materials | $100,000 |
| Less: Ending raw materials inventory | ($15,000) |
| Raw materials used | $95,000 |
| Add: Direct labor | $50,000 |
| Add: Manufacturing overhead | $60,000 |
| Total manufacturing costs | $205,000 |
| Add: Beginning work-in-process inventory | $20,000 |
| Less: Ending work-in-process inventory | ($25,000) |
| Cost of goods manufactured | $200,000 |
The following table shows the company’s income statement for the same period:
| Income Statement | |
| Sales revenue | $400,000 |
| Less: Cost of goods sold | ($200,000) |
| Gross profit | $200,000 |
| Less: Marketing expenses | ($40,000) |
| Less: Administrative expenses | ($30,000) |
| Operating income | $130,000 |
| Add: Interest income | $10,000 |
| Less: Interest expense | ($20,000) |
| Income before taxes | $120,000 |
| Less: Income taxes (30%) | ($36,000) |
| Net income | $84,000 |
As you can see from the tables above, the cost of goods manufactured amount of $200,000 is transferred to the finished goods inventory account on the balance sheet (not shown here). The cost of goods sold amount is then calculated by subtracting the ending finished goods inventory balance from the beginning finished goods inventory balance plus the cost of goods manufactured. The cost of goods sold amount of $200,000 is reported on the income statement as an expense that is deducted from the sales revenue of $400,000 to determine the gross profit of $200,000. The gross profit margin is 50% ($200,000 / $400,000).
By looking at these statements together, you can see how your production costs affect your profitability and how you can improve it by managing your production costs more efficiently.
Conclusion
The cost of goods manufactured schedule is a useful tool for manufacturing businesses to calculate their production costs and to understand how they affect their income statement. By analyzing this schedule, you can identify opportunities to reduce your production costs, improve your product quality, increase your sales volume, or adjust your pricing strategy. This can help you improve your profitability and competitiveness in the market.